
INVESTMENT
What returns can I expect?
Forecasting returns is a seemingly impossible yet essential part of financial planning. We have at least to try, while recognising the uncertainty in any attempt we make.
At some point in developing our financial plan, we need to make a forecast about investment returns. If we’re too optimistic we might not save enough and risk missing our financial goals. If we’re too pessimistic we wear a hair shirt today only to find we’re vastly over-provided for in future.
History can be our guide, but no more. One of the things that most financial markets experts agree on is that we should expect returns in future to be lower than in the past, certainly the recent past. Low interest rates and lofty market valuations make that a near certainty.
The purpose of this article is to help you build a reasonable set of assumptions for building a central forecast, but also ranges around that. If you have a financial planner doing this for you, then this article should help you ask awkward questions to make sure they’re doing it right.
At the end I provide a super-simple planning hack to help you build a plan on the back of an envelope.
Returns on bonds
But first we need to recognise that there are two ways in which we can use bonds in our investment portfolio. One is to buy, say, inflation-linked government bonds to match a particular future inflation-linked cashflow need. In this case we will hold the bond until it matures. We know almost exactly what yield we will receive, based on the redemption yield at the point we buy the bond. Given that this article is written mainly for UK investors, the relevant yield is that on medium to long-term inflation-linked government bonds. This is currently negative and fairly stable across durations above around 10–15 years: (1%) to (1.5%) pa approximately, when measured against CPI.
The other way in which we use bonds is in the form of a bond fund that acts as a stabiliser alongside equities in a 60/40 portfolio or similar. In this case the bonds aren’t held to maturity, but instead the portfolio is constantly traded to maintain the average remaining term of the bonds it holds. So, for example, a long-term government bond fund might aim to keep the average maturity of the bonds that it holds at 20–25 years.
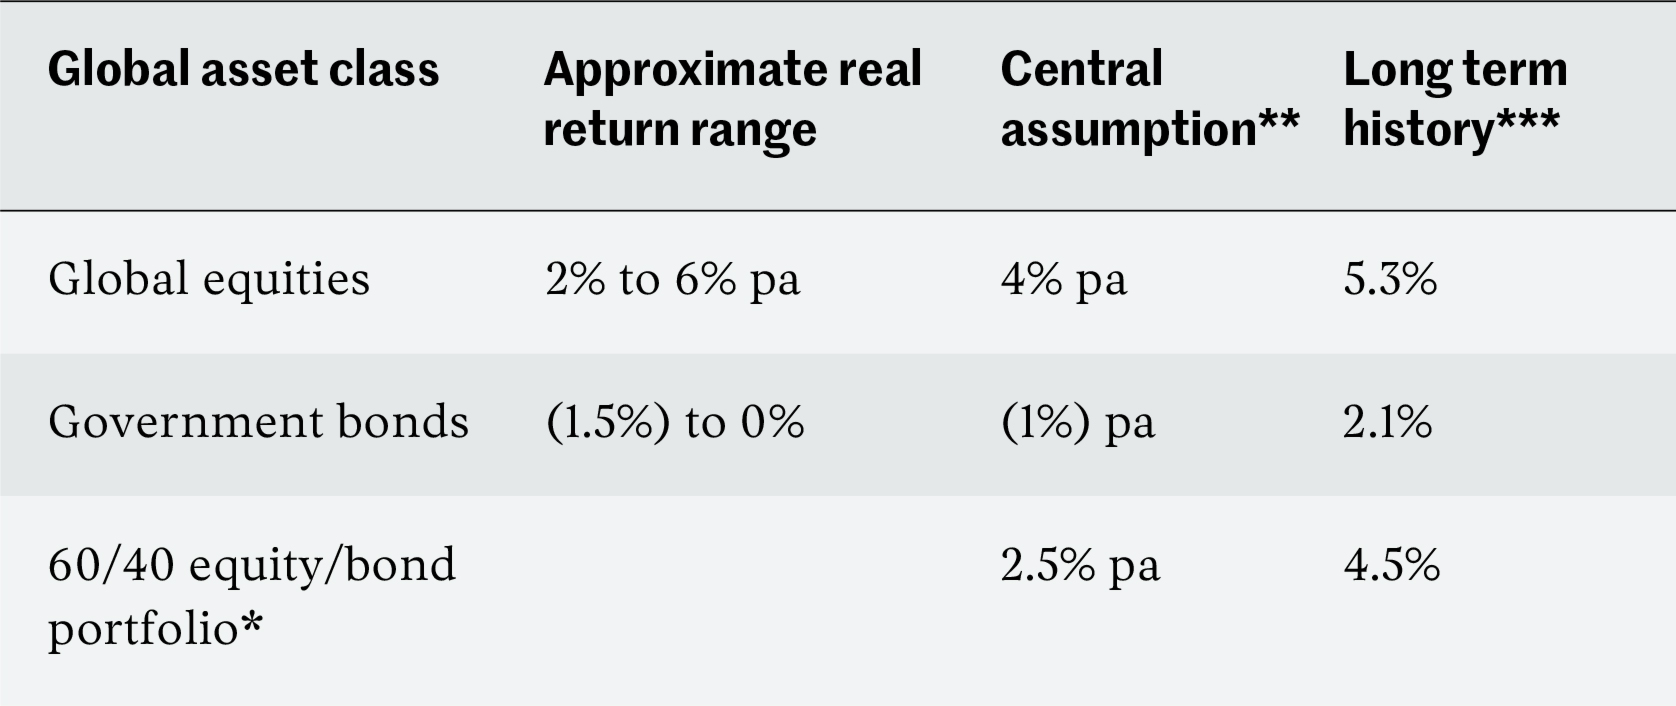
Fortunately, research shows that we can quite accurately predict the return on such a fund over a period equal to the average maturity of the bonds held: it is simply the current redemption yield for bonds of that term1. So again, for a UK investor, we can use a real long-term return assumption on a bond fund of (1%) to (1.5%) pa approximately. Real returns on international developed country government bonds, especially US, are slightly higher at up to around zero. For our central assumption, assuming a bond portfolio biased towards the UK, we can take a central assumption of (1%) pa. This is our first stake in the ground:

*Credit Suisse Yearbook 2021, returns since 1900
Note that our central assumption is fully three percentage points below the long-term historic return on government bonds (and six percentage points below returns over the last 20 years), reflecting low current interest rates following the great bond bull market of the last few decades.
Returns on equities
Returns on equities are harder to predict.
Many models exist and they do not always agree. Simple models add the dividend yield to an assumed dividend growth rate. But the assumption then needs to be adjusted for any change in the overall valuation multiple of the market (the so-called pricing adjustment) which is highly uncertain. Models such as the Cyclically Adjusted Price Earnings (CAPE) ratio can help with this, although their efficacy is contested.
The major investment houses publish their expectations for future investment returns each year, which they feed into their strategic allocation models. If you search for ‘capital market assumptions’ you can normally find the house view for prospective asset class returns for a range of major investing houses. Surveying these assumptions across a dozen major asset managers allows us to add a row of assumptions for global real equity returns. I’ve also added the resulting implied returns from a 60/40 portfolio.

*Including 0.5% pa rebalancing premium.
**Average of forecasts for global equities.
***Credit Suisse Yearbook 2021, returns since 1900, my estimate for 60/40.
Note that provided the returns between bonds and equities do not deviate too far from each other, rebalancing a 60/40 portfolio tends to produce a ‘buy low, sell high’ effect that adds around 0.5% a year to returns. Note that this premium isn’t guaranteed (in effect rebalancing is an active strategy) and in extreme markets can turn negative. But it is reasonable to include in a central assumption.
There are outliers. Permabears GMO, founded by Jeremy Grantham, have the distinction of having called the dotcom crash correctly (if a bit early). As his January article makes clear, they believe the US stock market in particular is showing signs of an epic bubble. They expect real returns of negative 7.3% a year for US large cap stocks over the next seven years as compared with negative 2.3% a year for international stocks. These figures equate to cumulative negative return of over 40% in the US and 15% for non-US markets.
Although GMO’s position is something of an outlier, the view is not wholly inconsistent with the views from other investment houses, almost all of which expect underperformance compared with long-run history, especially in the US. Differing assumptions partly portray a difference in view as to whether current high valuations are going to ‘pop’ imminently, as GMO believe, or gradually deflate as seems to be the market consensus. I’ve excluded the GMO figure from the averages above as it’s based on a clear view that markets are not currently rationally priced. To my mind, it therefore works better as informing a downside scenario than as part of a central assumption. I return to this later.
The central assumption column shows the pre-tax pre-expenses figures I tend to use. Are these reasonable as a central guess? I’d say so for the following reasons:
- The assumed return on bonds is aligned with current long-term bond yields, which is the best estimate of future returns both for a bond held to duration and a bond fund where duration is maintained.
- The real return on equities is below the long-term median of 5.3% for global equities over the last 120 years, which is consistent with low interest rates, elevated current valuations (especially in the US) and the fact that global equities have out-performed their long-term trend for several decades.
- The gap between equity and long-term bond performance in these assumptions is around 5% a year, which is above the 120 year average of just over 3%. Given the 40 year bull market in bonds, which has resulted in the gap between equity and bond performance being a very meagre 1% a year since the early 1970s, a period of stronger relative performance for equities should not be surprising.
So while we know these assumptions will be wrong, as a central guess they are reasonable and seem to fit the current facts as we know them, without being excessively optimistic or pessimistic.
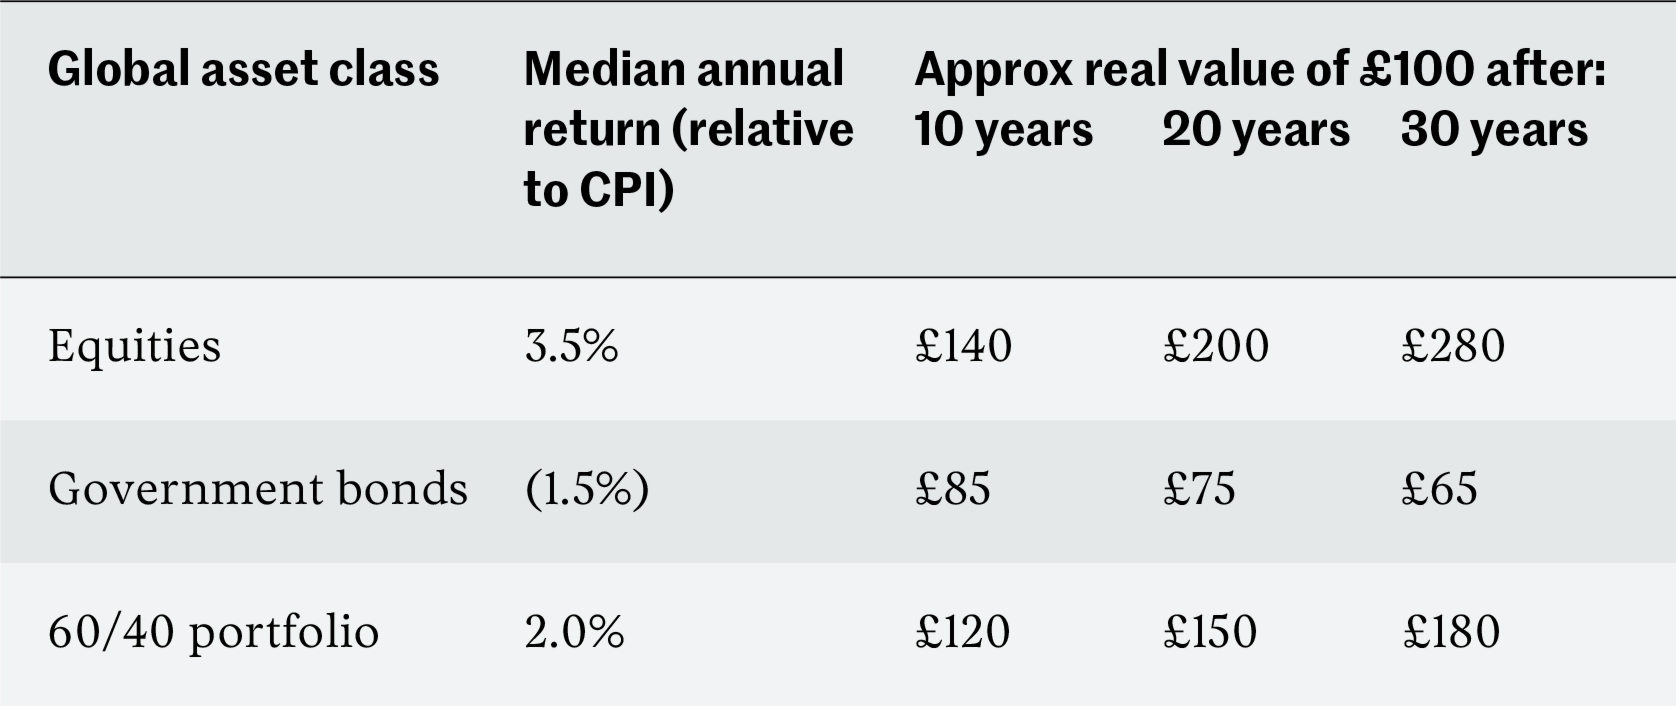
Taking the centre of the ranges above and deducting 0.5% for fund and platform costs, I tend to use the following central assumptions for financial planning purposes:

So for example, based on these assumptions, £100 invested in equities will roughly double over 20 years in real terms, compared with 50% growth in a 60/40 portfolio and a decline of 25% if held in government bonds.You might also want to make some allowance for tax for funds not held in pension or ISA. If your taxable assets are held by a non tax payer or a basic rate taxpayer (e.g. a spouse) then in practice the tax leakage is quite low – likely no more than 0.5% a year. For a higher rate taxpayer it can be more significant, perhaps 1.5% a year.
Allowing for uncertainty
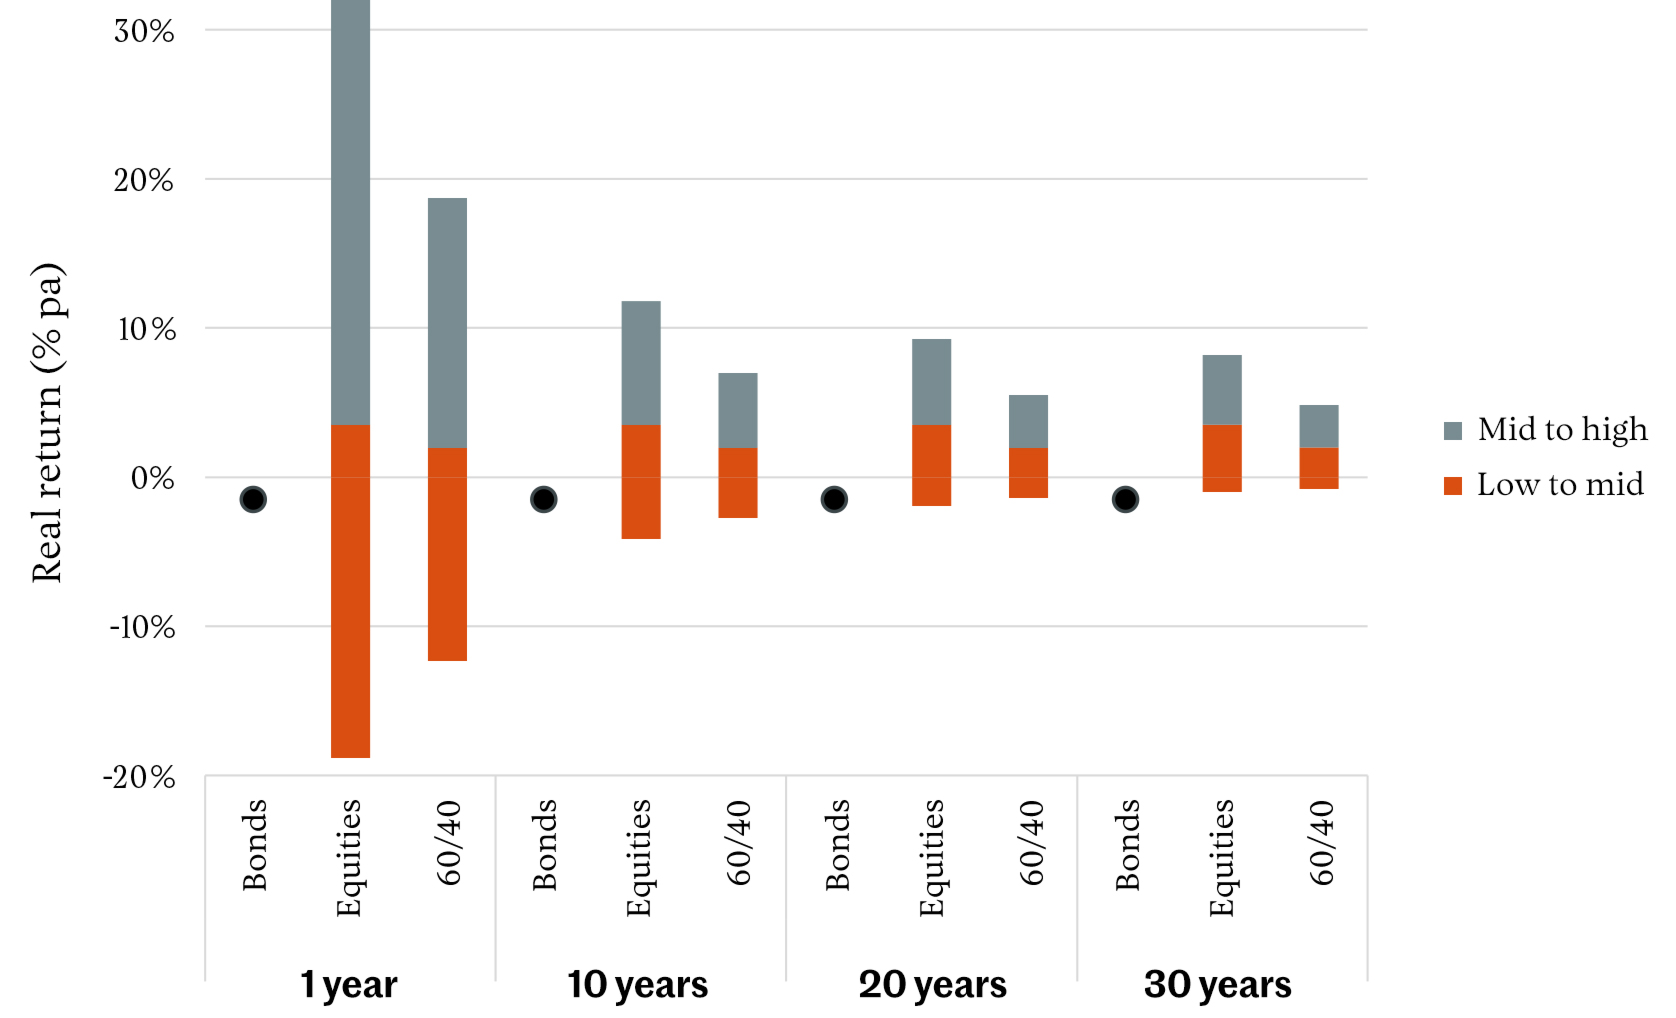
What about the range of returns? Using historic data, we can estimate the potential range of equity and bond returns2. The ‘low’ and ‘high’ assumptions reflect returns at each extreme that might each be realised 10% of the time (in other words, returns should fall within the range shown 80% of the time). This still allows for the fact that returns can be more extreme on either side — anything can happen. In particular, any strategy should be stress tested against a rapid stock market fall of around 50%, which has been experienced on more than one occasion in history. If you’d like a table of these assumptions, drop me a line.

To put these scenarios in context, the bearish GMO assumptions equate to around 5% negative annual real returns on a global equity portfolio over seven years. This is almost precisely aligned with the lower 10% scenario from these ranges.
There’s evidence that extreme outcomes, particularly over the short term, may be more frequent than suggested by normal distributions — the so-called ‘fat tails’ property of equity market returns. But by the same token, they may be less frequent over the long term, with some experts believing that equity returns have a tendency to revert to the mean. For example, the modelling suggests that an equity portfolio will deliver a negative real return over 30 years around 10% of the time. But this has never happened in history for global equities. For this reason, in his classic text Stocks for the Long Run, Jeremy Siegel argues that stocks are less risky than bonds in the long run. However, the small number of truly independent periods in history of 30 years or more make this a challenging assertion to test statistically.
Overall, for planning purposes these ranges are good enough, and the shape of returns is broadly consistent with long term history, taking into account today’s starting point in terms of interest rates and stock market valuations.
The return for government bonds is shown on the chart for an inflation-linked bond held to maturity, so the real return on a government bond holding is certain and shows no range. It’s worth noting that over 20 years or more, this guaranteed government bond return is roughly at the lower 10% of outcomes for an equity or 60/40 portfolio. This doesn’t mean they are a waste of money — worse scenarios than those modelled could occur (pace GMO). But it does emphasise that the insurance provided by government bonds is expensive, especially at current yields. Therefore, you probably don’t want to overdo it.
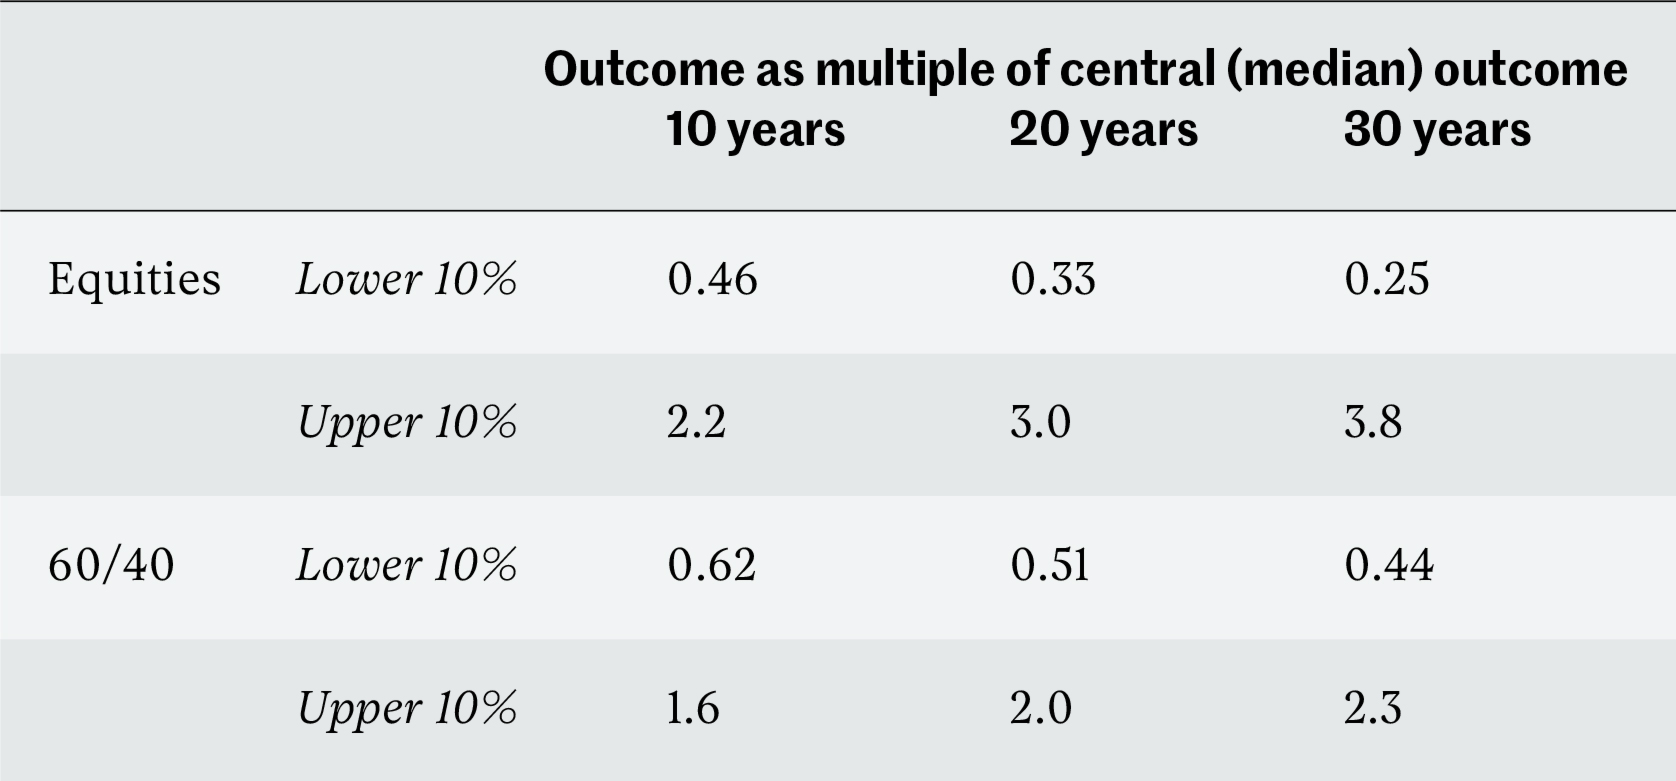
What do these ranges mean in terms of cumulative potential outcomes compared with the central case? Remember these are compound rates of return, so the cumulative ranges actually widen over time, even though the annual rates appear to narrow.

These are wide ranges and show the uncertainty inherent in investing. There’s no avoiding this, unless you are prepared to sacrifice returns entirely and invest everything in risk-free bonds. But the returns from these are so low, this creates its own risk of not meeting your goals or living your life to the full.
Building assumptions into your plan
In my suggested planning process I describe how to differentiate between goals with low, medium and high flexibility. These can then be matched with bonds, a 60/40 portfolio, or equities (or similar). The central assumptions can be used in your planning process to test the affordability of your resulting plan on a central ‘best estimate’ case. The ranges can then be used to give a sense of what could result on the upside or downside.
And here’s a little planning hack. The charts above show that an assumption of zero real returns is a conservative but not outlandish assumption over periods of 10 to 30 years for a portfolio that contains a mix of equities and bonds (like most portfolios do). In fact, around 25% of scenarios show a mixed portfolio as having a negative real return.
If you assume zero real investment returns, you can vastly simplify your planning. Simply express all of your goals, future earnings and savings, and portfolio values in real terms. You then don’t need to adjust for investment returns at all, as the assumption is that these just cover inflation. You can just add the future savings to the current fund value and compare with the future goal requirement.
With luck you’ll do better than this — it’s a somewhat conservative assumption. But to get a rough handle on where you are on a conservative basis, without the need for a cashflow model or even a spreadsheet, it’s not a bad approach.
Do the best you can
No-one can be sure what the future holds. That’s why we need to stress test our plan under a range of unlikely but feasible scenarios. It’s also why we need to ensure that at least a minimum level of income is guaranteed through a mix of the state pension, defined benefit pensions, annuities or a ‘bond ladder’ of index-linked government bonds.
But we have to start somewhere in building a plan. And it’s perfectly possible to build a set of assumptions that takes account of history, current interest rates and what we know about current market valuations. These assumptions will be wrong. But over the long term there’s reason to hope they will at least be directionally correct.
Notes
1. A rise in interest rates will cause a capital loss on the fund but will enable reinvestment at higher coupon rates as the fund is rolled over to maintain its duration. The two effects tend to offset. The same holds in reverse for a fall in interest rates. See for example Beyond Diversification by Sébastien Page.
2. I use a standard deviation (volatility) of 19% for equities and 8% for long-dated government bonds and assume a standard (log) normal distribution of returns.
Important
Nothing in this article should be taken to represent financial advice. It is generic commentary based on typical circumstances and not tailored to your own situation. If you’re not sure what to do, you should take financial advice.
